


PART 4 · BUILDING COMPETENCE
Lesson 8. Project management methodologies
Reading time ≈ 30 min · Based on Chapter 8 of the book
Do first things first, and second things not at all.
— Peter Drucker
| LEARNING OBJECTIVES
After this lesson you will be able to: • Classify projects by their system characteristics and the uncertainty of technical requirements. • Use the traditional toolset: WBS, Gantt, critical path, critical chain, PERT, estimating, S-curve and EVM. • Explain the 4 Agile values, the life-cycle types and the Scrum events. • Choose a methodology that fits the organisation, resources, team and project complexity. |
No two projects are identical, even “twin” projects with the same owner, contractor and equipment. So the way we manage them must also be chosen to fit. This lesson introduces the two most widely used methodologies and how to choose between them.
Classifying projects by uncertainty
Projects can be assessed along two axes:
| AXIS 1
System characteristics Many or few subsystems; many or few stakeholders and how complex their relationships are; long or short duration; how interdependent the components are. |
AXIS 2
Technical and technological uncertainty Fixed or frequently changing scope; clear or vague technical requirements; high or low technology risk. |
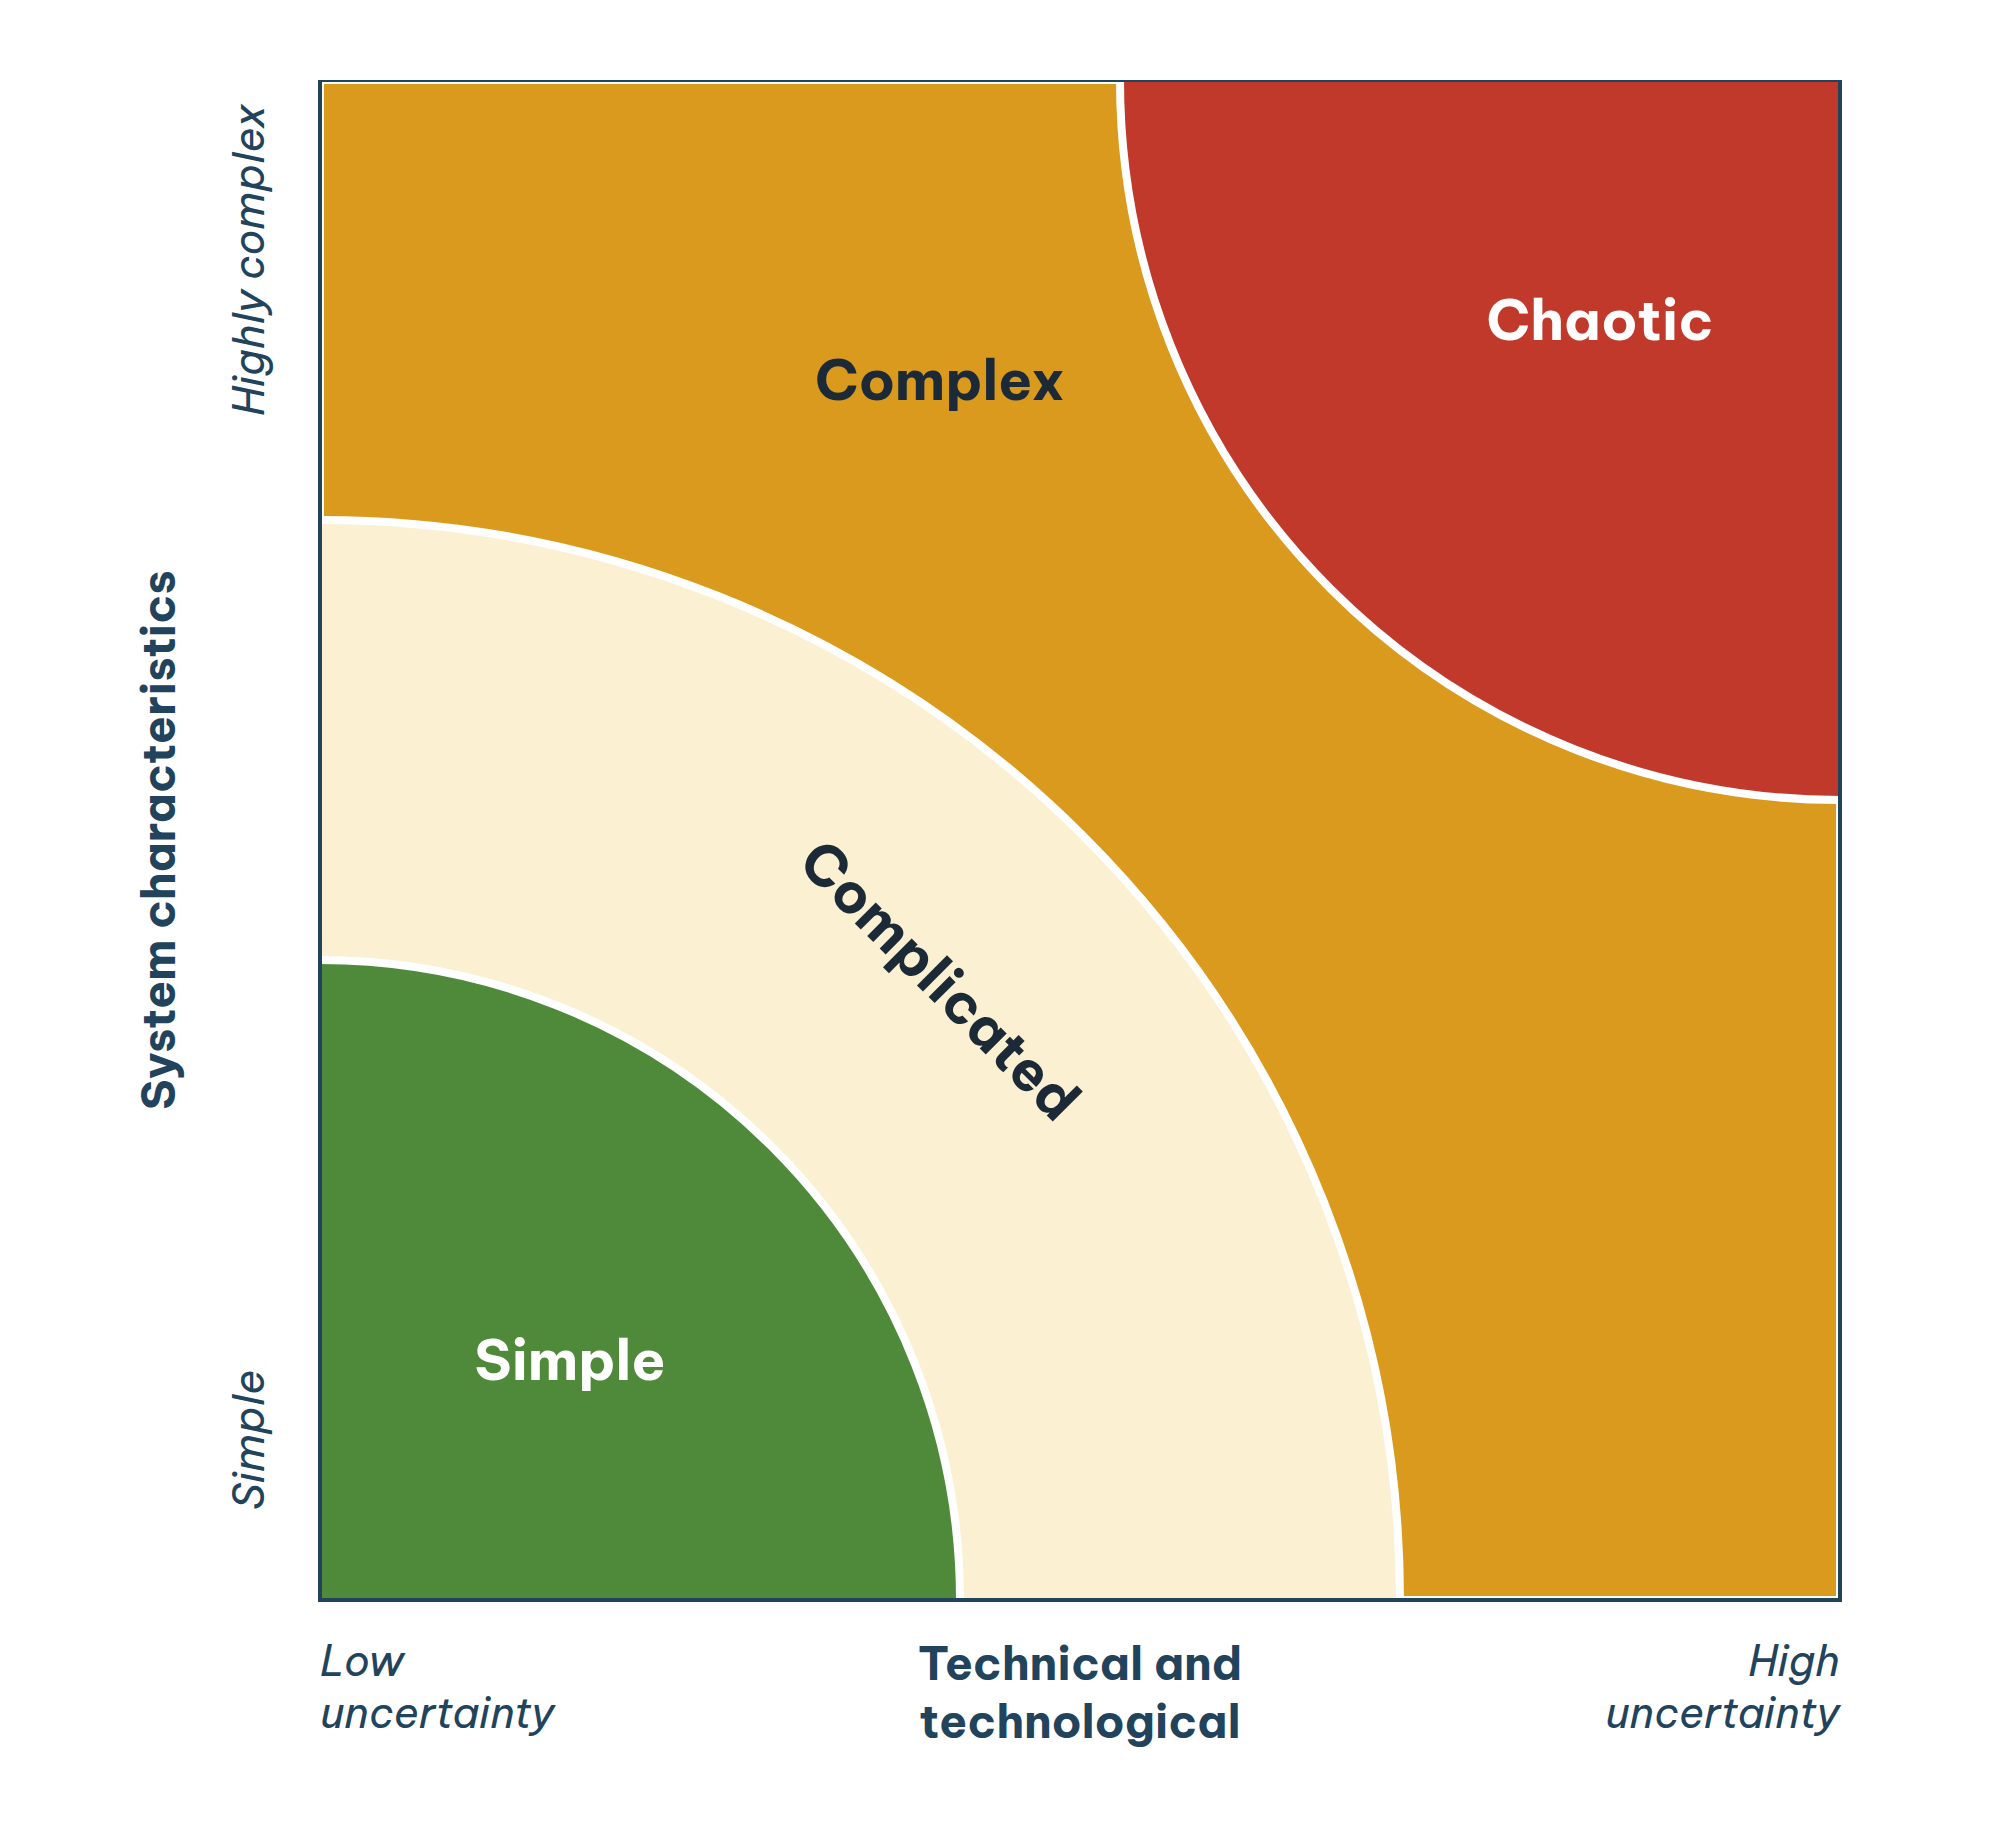
Figure 8.1. Classifying projects by uncertainty: simple, complicated, complex and chaotic.
A project management methodology is a system of principles, practices, processes, methods and templates. Expected benefits: better governance and decisions (selecting, approving, changing or stopping projects); better delivery processes, lower risk, controlled change; and a consistent understanding across the organisation.
Typical methodologies include traditional (waterfall), PRINCE2, Agile, Lean, complex project management and extreme project management.
The traditional methodology
Also called waterfall, it rests on three principles: meet the requirements and objectives set at the start; complete the project sequentially in phases (a predictive life cycle); and organise management hierarchically.
Work Breakdown Structure (WBS)
A WBS breaks the project down into work packages for easier execution, control and management, identifying all the work needed to meet the objectives. It underpins the network schedule, cost, organisation structure, responsibility matrix, risk analysis and project coordination.
Gantt chart
Developed by Henry Gantt in 1917: tasks listed down the left, time across the top, each task a horizontal bar. Simple and easy to communicate, but it does not show dependencies between activities.
Critical Path Method (CPM)
| CONCEPTS
The critical path is the longest path through the network from start to finish, with the least total float, usually zero. If any activity on it slips, the whole project slips. Float is the spare time between an activity’s earliest start and latest finish, letting it flex without affecting the project end date. |
Steps: draw the network → identify every path → total each path’s duration → the longest is the critical path.
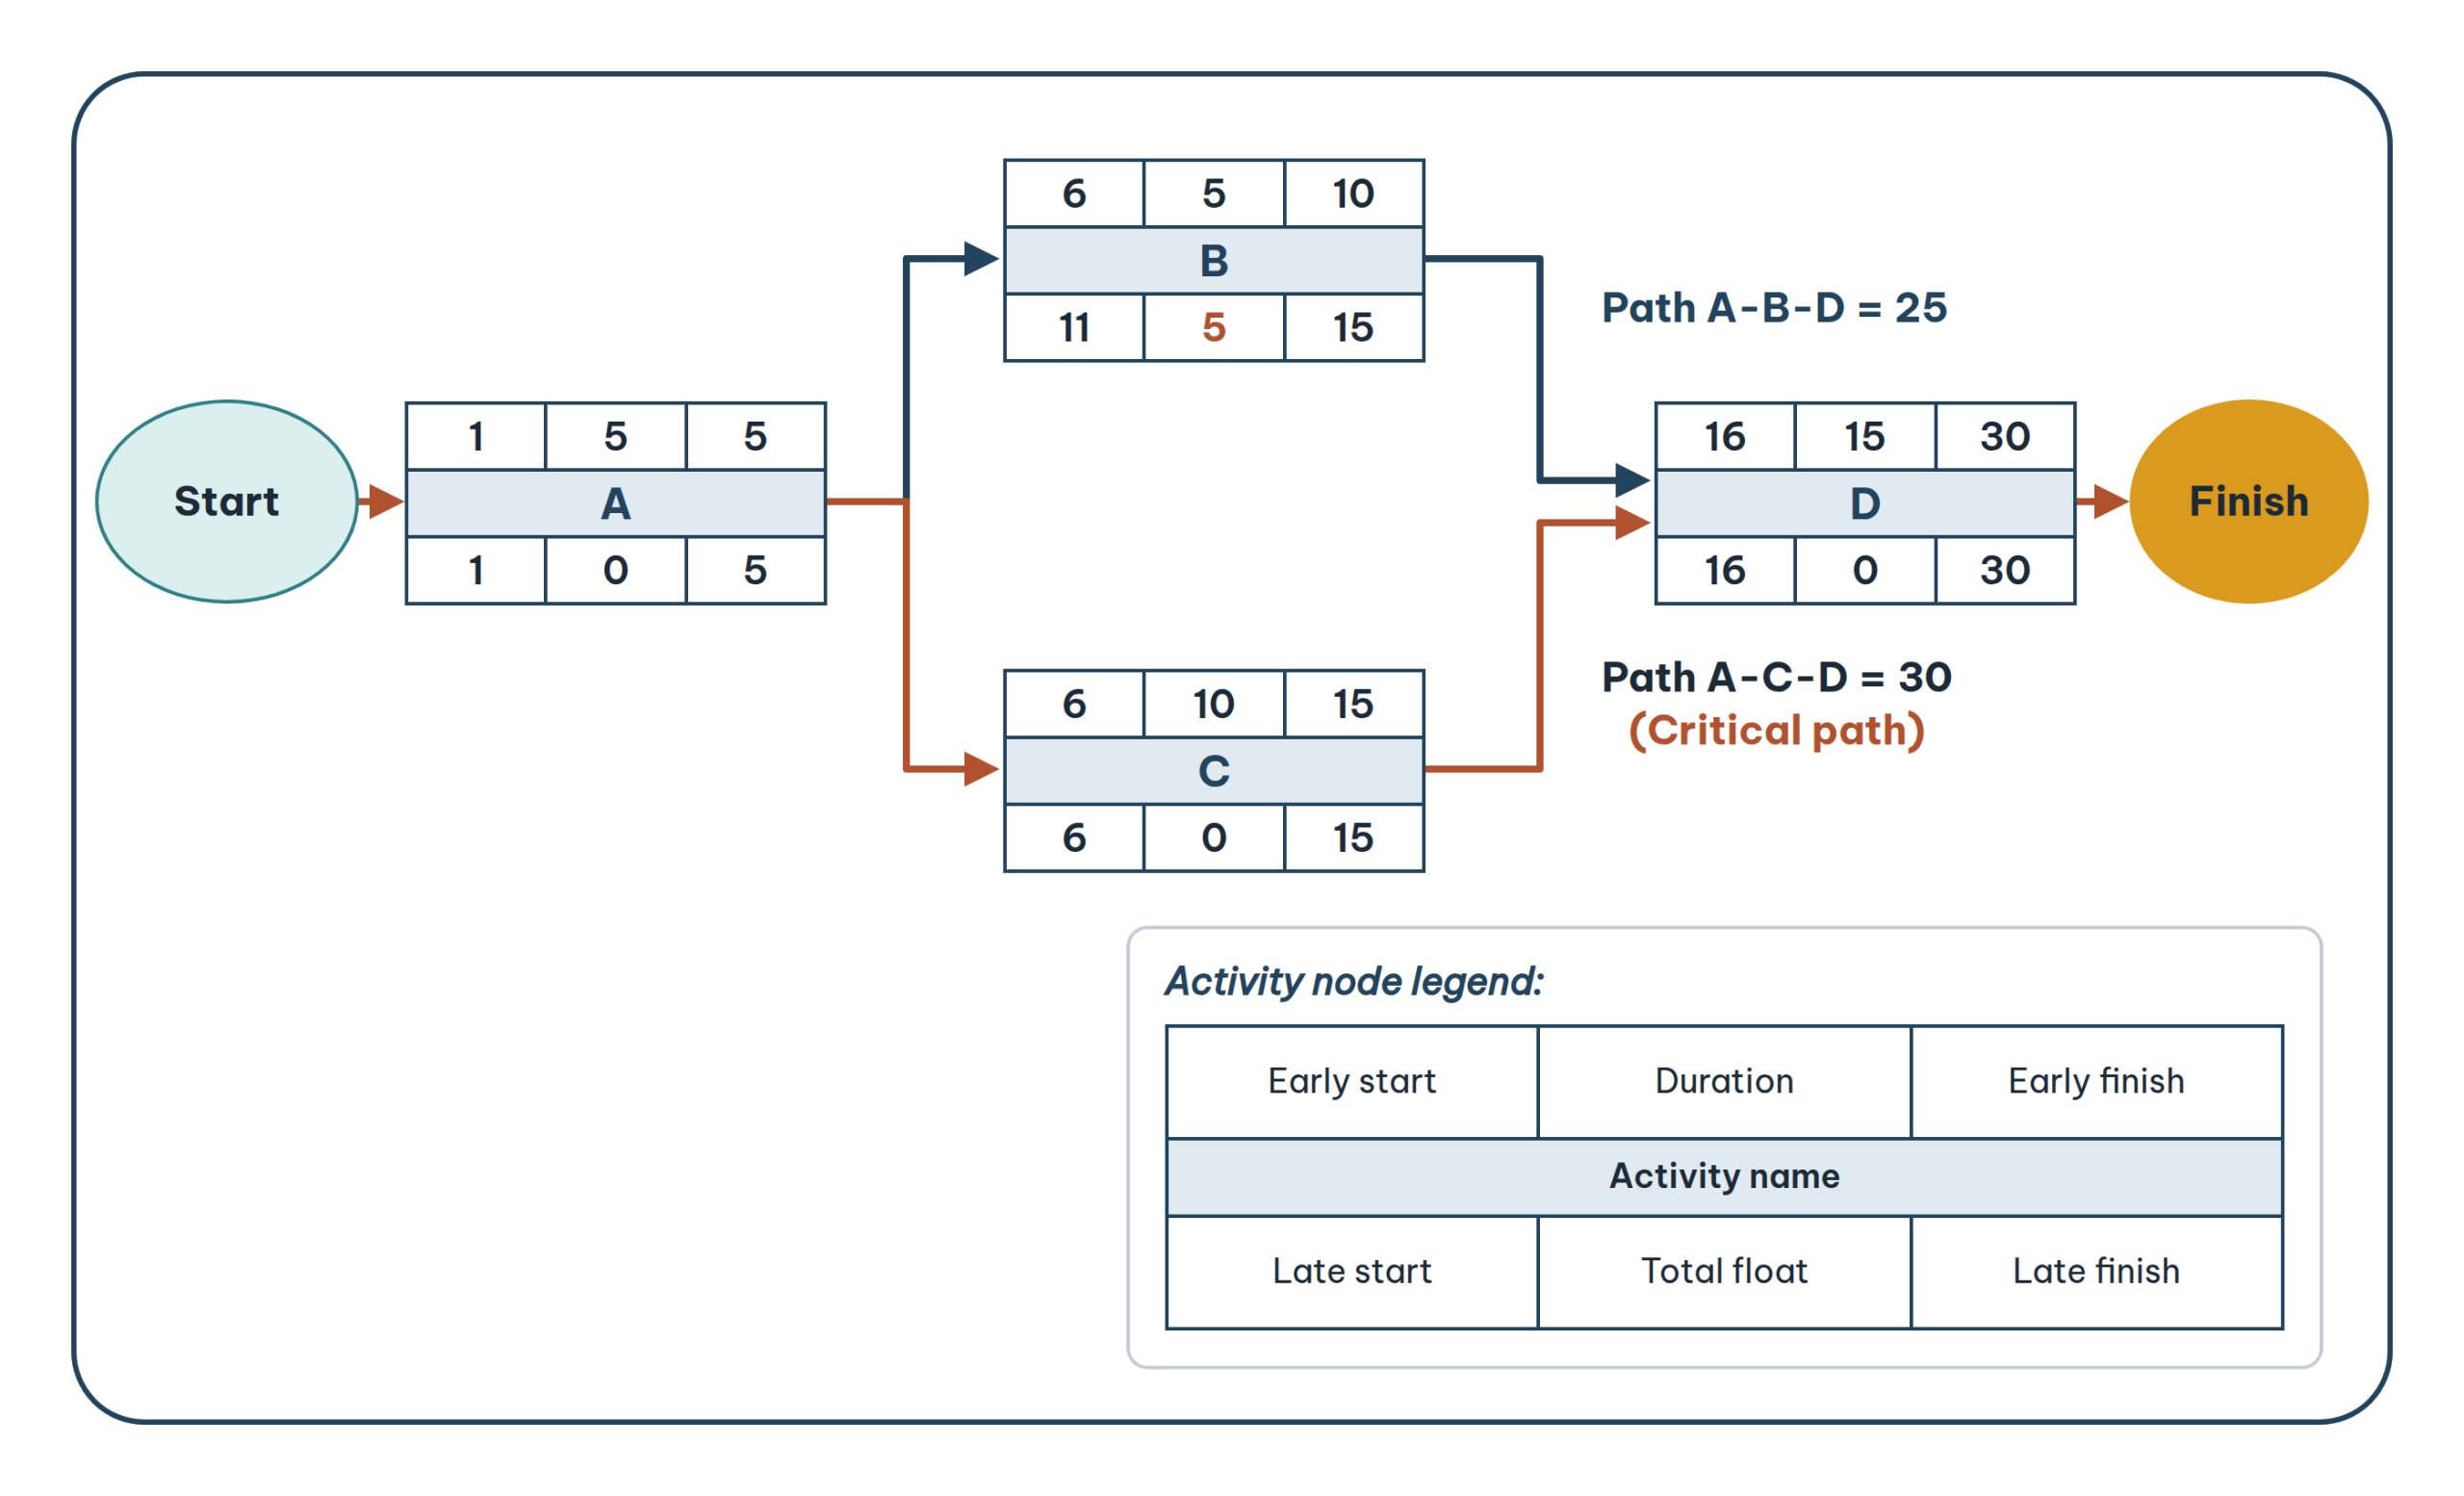
Figure 8.7. Example of determining the critical path.
Limitations: assumes resources are always available; ignores resource dependencies; pays little attention to non-critical activities.
Critical Chain (CCPM)
Eliyahu M. Goldratt defined the critical chain as the longest path taking account of resource constraints and activity dependencies. The critical path is the special case where resources are unlimited. Float is replaced by buffers:
| Project buffer
Placed between the last activity and the completion date. Contingency is not added to each activity but pooled here, typically at about 50% of the total estimated contingency. Time saved by early finishes is added back to the buffer. |
Feeding buffer
Inserted at the end of non-critical chains, before they join the critical chain, so delays there do not spill onto it. |
Resource buffer
Placed along the critical chain to ensure critical people and equipment are ready when needed. |
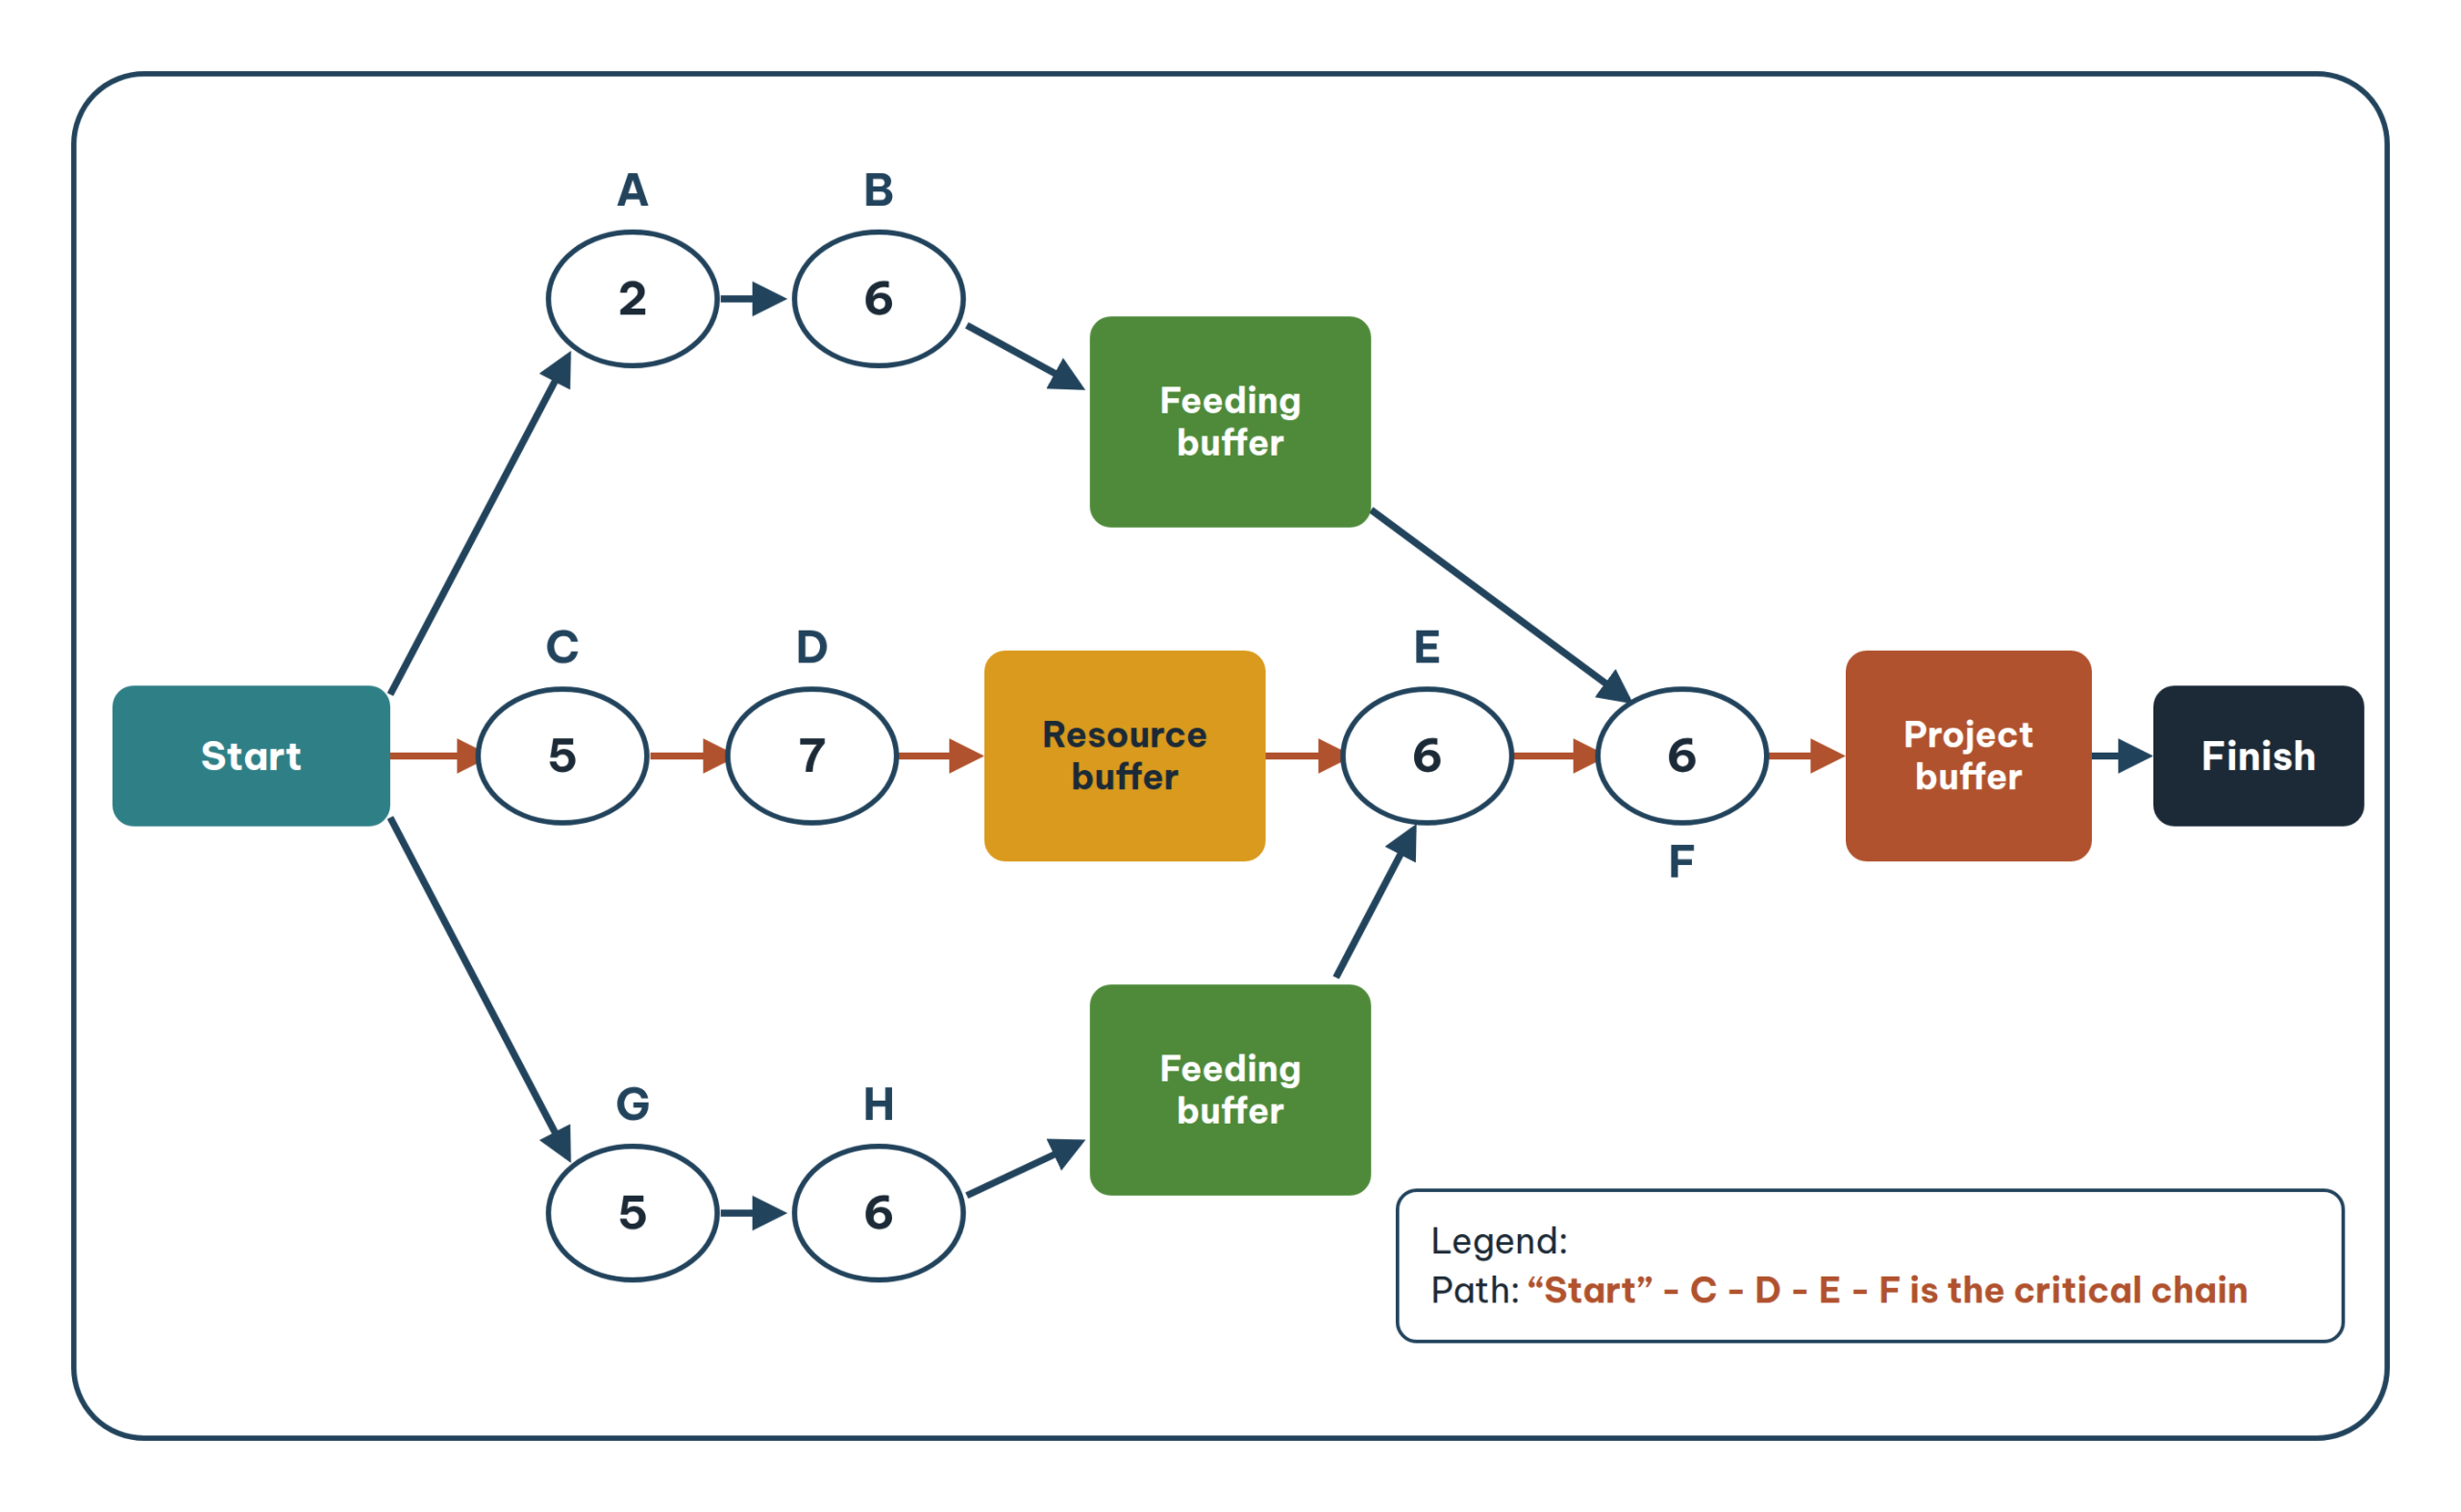
Figure 8.8. Example of determining the critical chain.
PERT
Introduced by the US Department of Defense in 1958–1959 for large military programmes. Instead of one “standard” duration, PERT uses three estimates: optimistic (to), most likely (tm) and pessimistic (tp).
te = (to + 4·tm + tp) / 6 σ = (tp − to) / 6
| WORKED EXAMPLE
PERT expected-time Example: optimistic to = 8, most likely tm = 12, pessimistic tp = 22 days. Expected time te = (8 + 4×12 + 22) / 6 = 13.0 days; standard deviation σ = (22 − 8) / 6 ≈ 2.33 days. Range te ± σ ≈ 10.7 – 15.3 days. An interactive calculator is available in the online lessons at pmsolutions.vn. |
Estimating techniques
| Technique | How it works |
| Expert judgement | Draws on the knowledge and experience of experts who have done similar projects. |
| Analogous estimating | Uses actual data from similar projects when detailed data is not yet available. |
| Parametric estimating | Uses mathematical or statistical relationships between variables. |
| Bottom-up estimating | Estimates each WBS work package and sums them. |
| Three-point estimating | Optimistic, pessimistic and most likely scenarios; calculates mean and standard deviation. |
Cumulative S-curve
A cumulative plot of cost, resources or quantities over time. It shows trends and supports data-based decisions. When the actual curve drifts further and further below the planned curve, the project is heading into trouble (Lesson 19).
Earned Value Management (EVM)
EVM combines scope, schedule and resources to assess progress and performance, supporting the plan – do – check – act cycle.
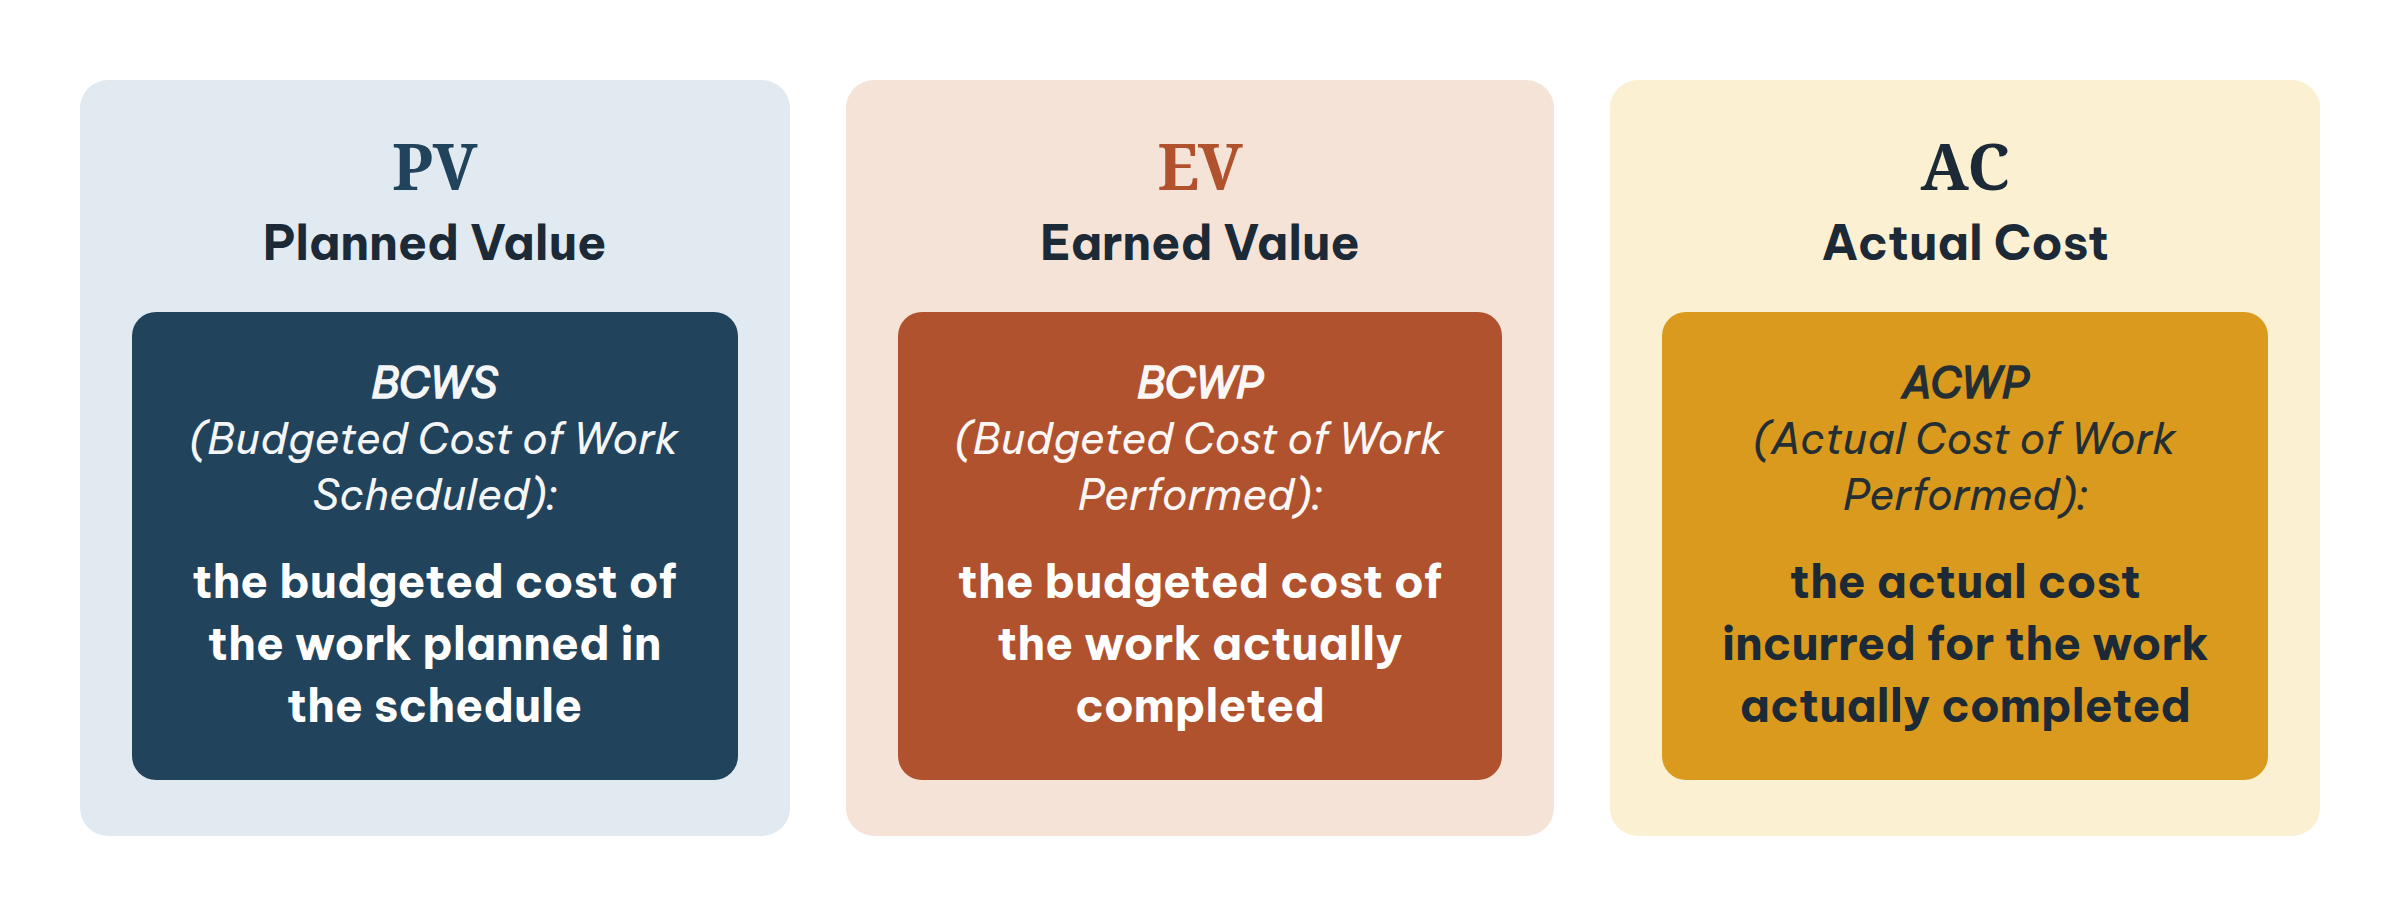
Figure 8.12. PV: how far the work was planned to be; EV: a snapshot of actual progress; AC: the resources spent to achieve EV.
| Indicator | Formula | Meaning |
| SV – schedule variance | EV − PV | Negative: behind schedule |
| CV – cost variance | EV − AC | Negative: over cost |
| SPI – schedule performance index | EV / PV | < 1: behind schedule |
| CPI – cost performance index | EV / AC | < 1: over budget |
| TCPI – to-complete performance index | (BAC − EV) / (BAC − AC) | > 1: remaining work must be more efficient |
| EAC – estimate at completion | BAC / CPI | Forecast total cost |
| VAC – variance at completion | BAC − EAC | Negative: forecast overrun |
| SV > 0, SPI > 1 | SV = 0, SPI = 1 | SV < 0, SPI < 1 | |
| CV > 0, CPI > 1 | Ahead of schedule, under budget | On schedule, under budget | Behind schedule, under budget |
| CV = 0, CPI = 1 | Ahead of schedule, on budget | On schedule, on budget | Behind schedule, on budget |
| CV < 0, CPI < 1 | Ahead of schedule, over budget | On schedule, over budget | Behind schedule, over budget |
| WORKED EXAMPLE
EVM Example, month four (any currency unit): BAC = 1,000; PV = 400; EV = 340; AC = 380. SV = 340 − 400 = −60; CV = 340 − 380 = −40. SPI = 340/400 = 0.85 (behind schedule); CPI = 340/380 ≈ 0.89 (over budget). EAC = 1,000/0.89 ≈ 1,117.6; VAC ≈ −117.6; TCPI = (1,000 − 340)/(1,000 − 380) ≈ 1.06. Conclusion: at the current cost efficiency the project is forecast to overrun by about 117.6; the remaining work needs a CPI of about 1.06 to stay within BAC. An interactive calculator is available in the online lessons at pmsolutions.vn. |
The agile methodology
Agile grew out of lean thinking: focus on value, work in small batches, remove waste. It rests on the 4 values and 12 principles of the Agile Manifesto (2001).
| Individuals and interactions
over processes and tools |
Working product
over comprehensive documentation |
| Customer collaboration
over contract negotiation |
Responding to change
over following a plan |
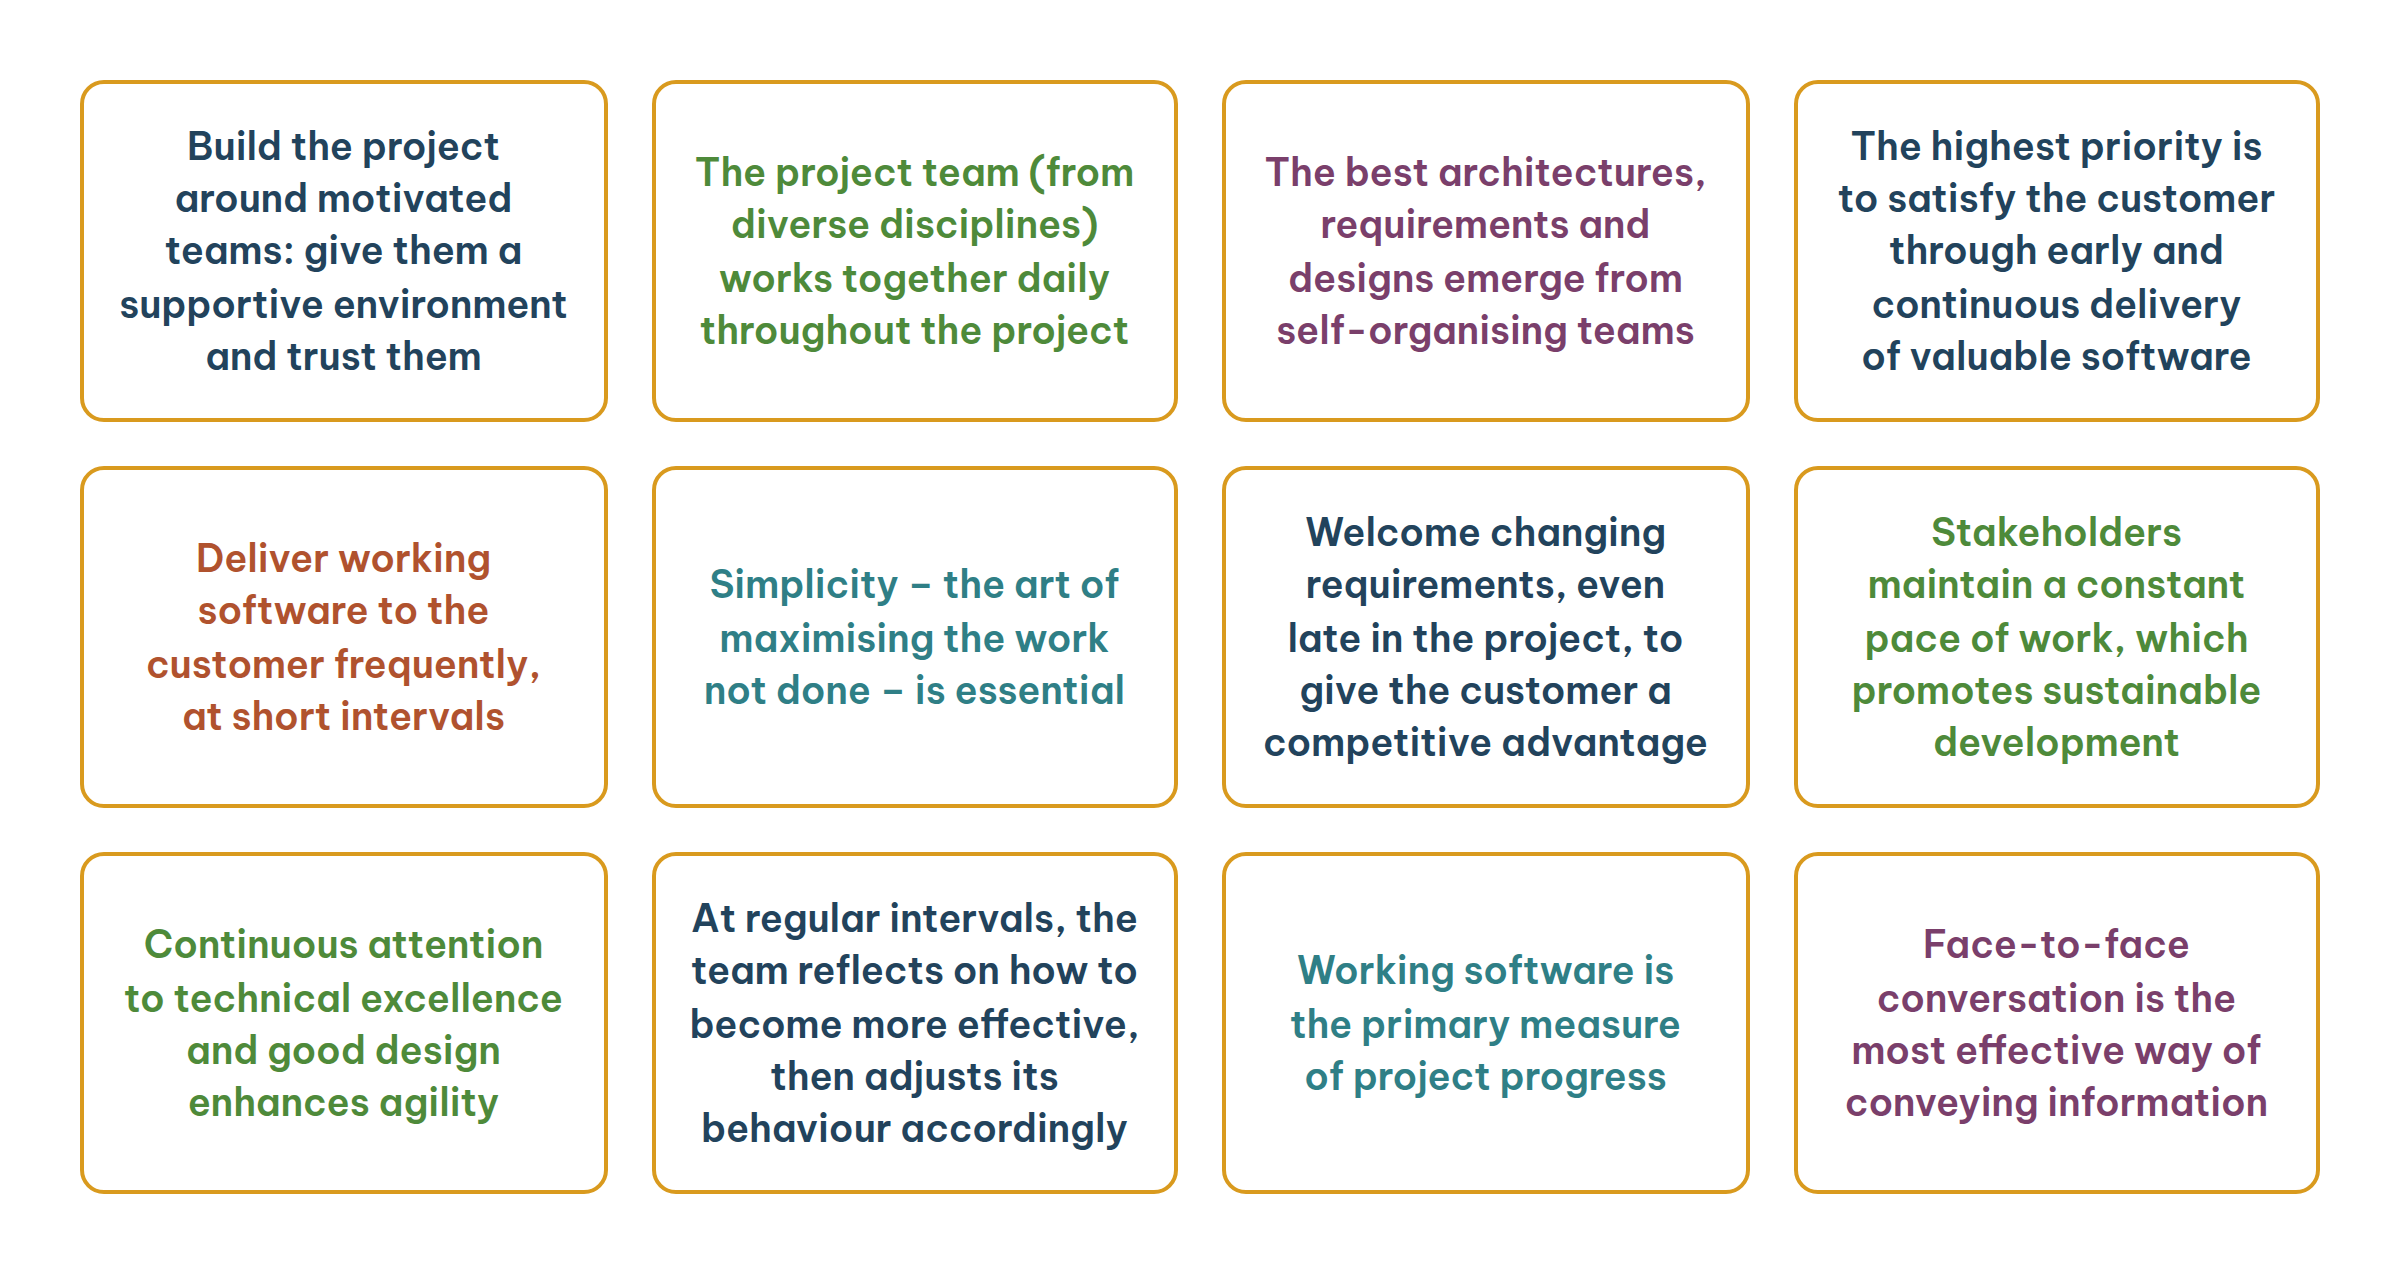
Figure 8.14. The Agile principles.
Three cyclical life cycles
| Life cycle | Characteristics | Delivery |
| Iterative | Repeats analyse – design – build – test until the right solution emerges | Once, at the end |
| Incremental | Builds the product up gradually in each cycle | Frequently, in small parts |
| Agile | Iterates until right and delivers frequently; iteration-based or flow-based | Frequently |
Planning: instead of a WBS, Agile breaks themes → epics → stories → tasks, with five planning levels: product vision, product roadmap, release plan, iteration plan and daily plan. EVM can still be used to measure progress.
Scrum
Scrum takes its name from rugby, where players bind shoulder to shoulder to drive the ball forward. It centres on teamwork, with short cycles (Sprints) of 1–4 weeks.
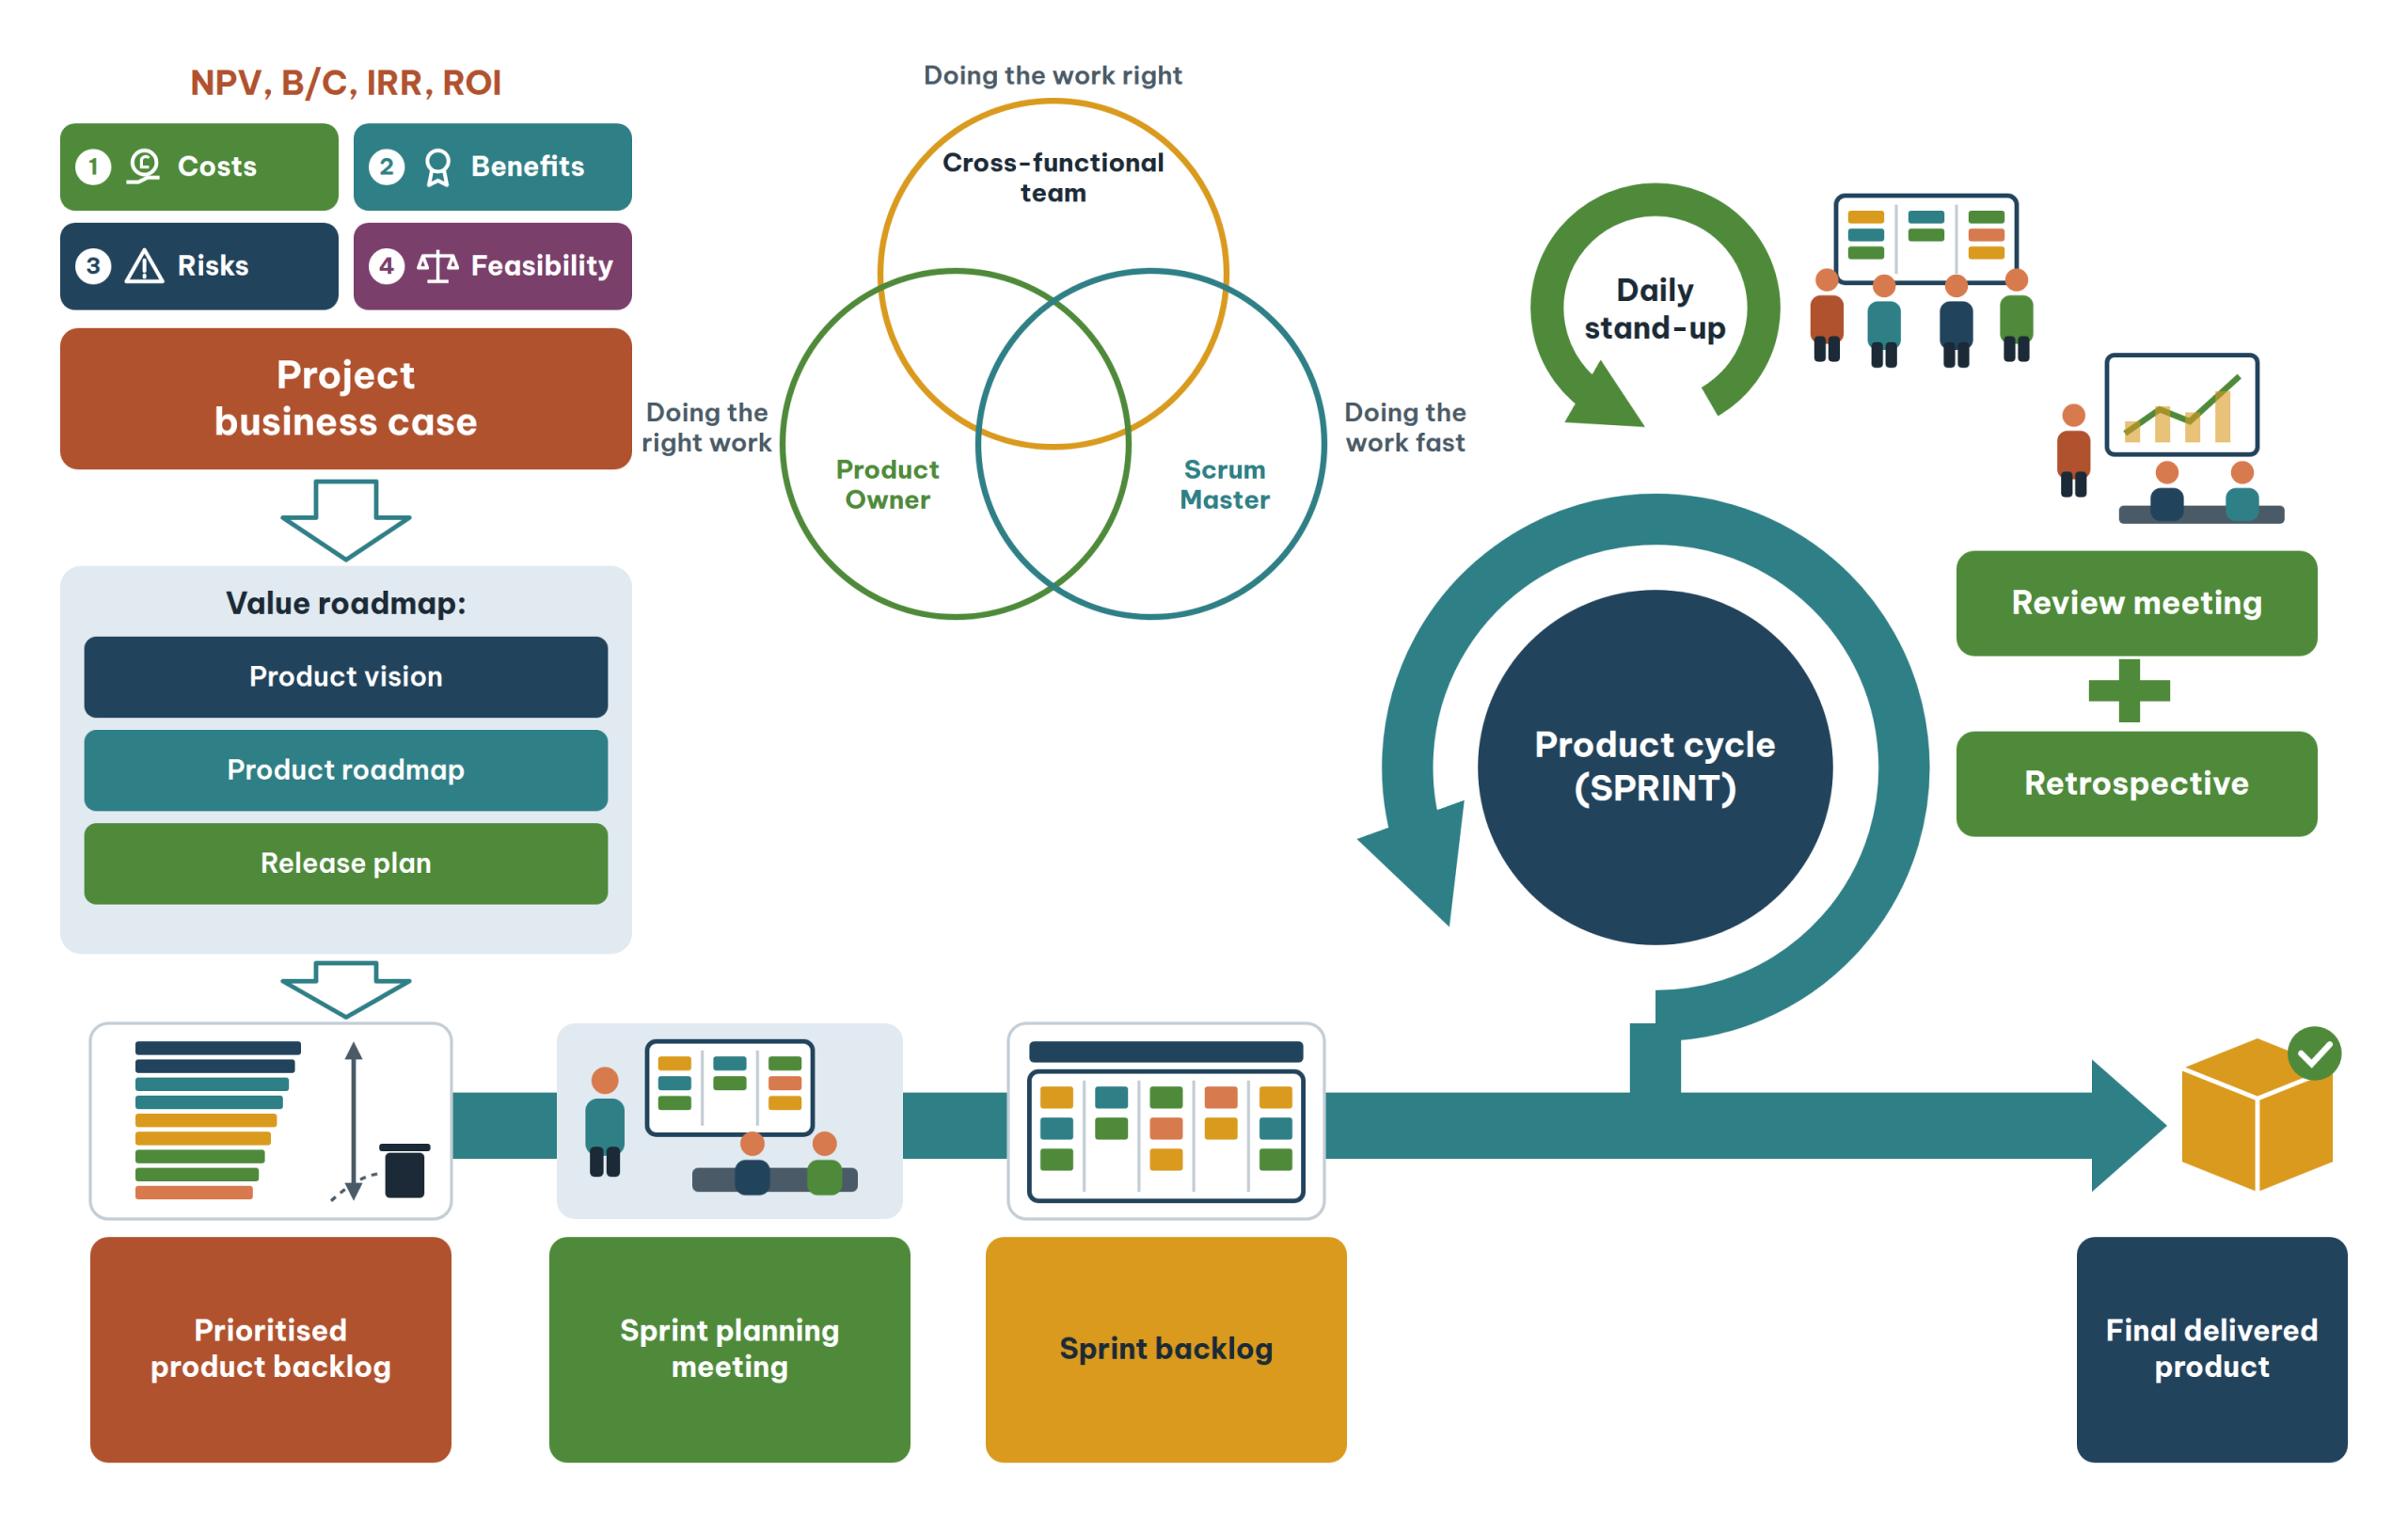
Figure 8.23. The Scrum method.
| Event | Duration | Purpose |
| Sprint planning | ≈ 1 hour | Refine the “to do” items for the next cycle; spot challenges; use impact mapping. |
| Daily stand-up | ≈ 15 minutes | Walk the Kanban board. Each person answers: what did I finish? what will I do next? what is blocking me? |
| Review | ≈ every 2 weeks | Demonstrate the cycle’s results; the Product Owner accepts or rejects them. |
| Retrospective | After a delivery, a milestone, a blockage, or several weeks | Qualitative and quantitative data → causes → remedies → action plan. Meet to learn, not to blame. |
| NOTE
To apply Agile, the project leader and core team need an agile mindset: thinking and acting around the 4 values and 12 principles. Agile tools without an agile mindset are just form. |
From traditional to complex project management
As projects move from simple to complex, the focus of management shifts too:
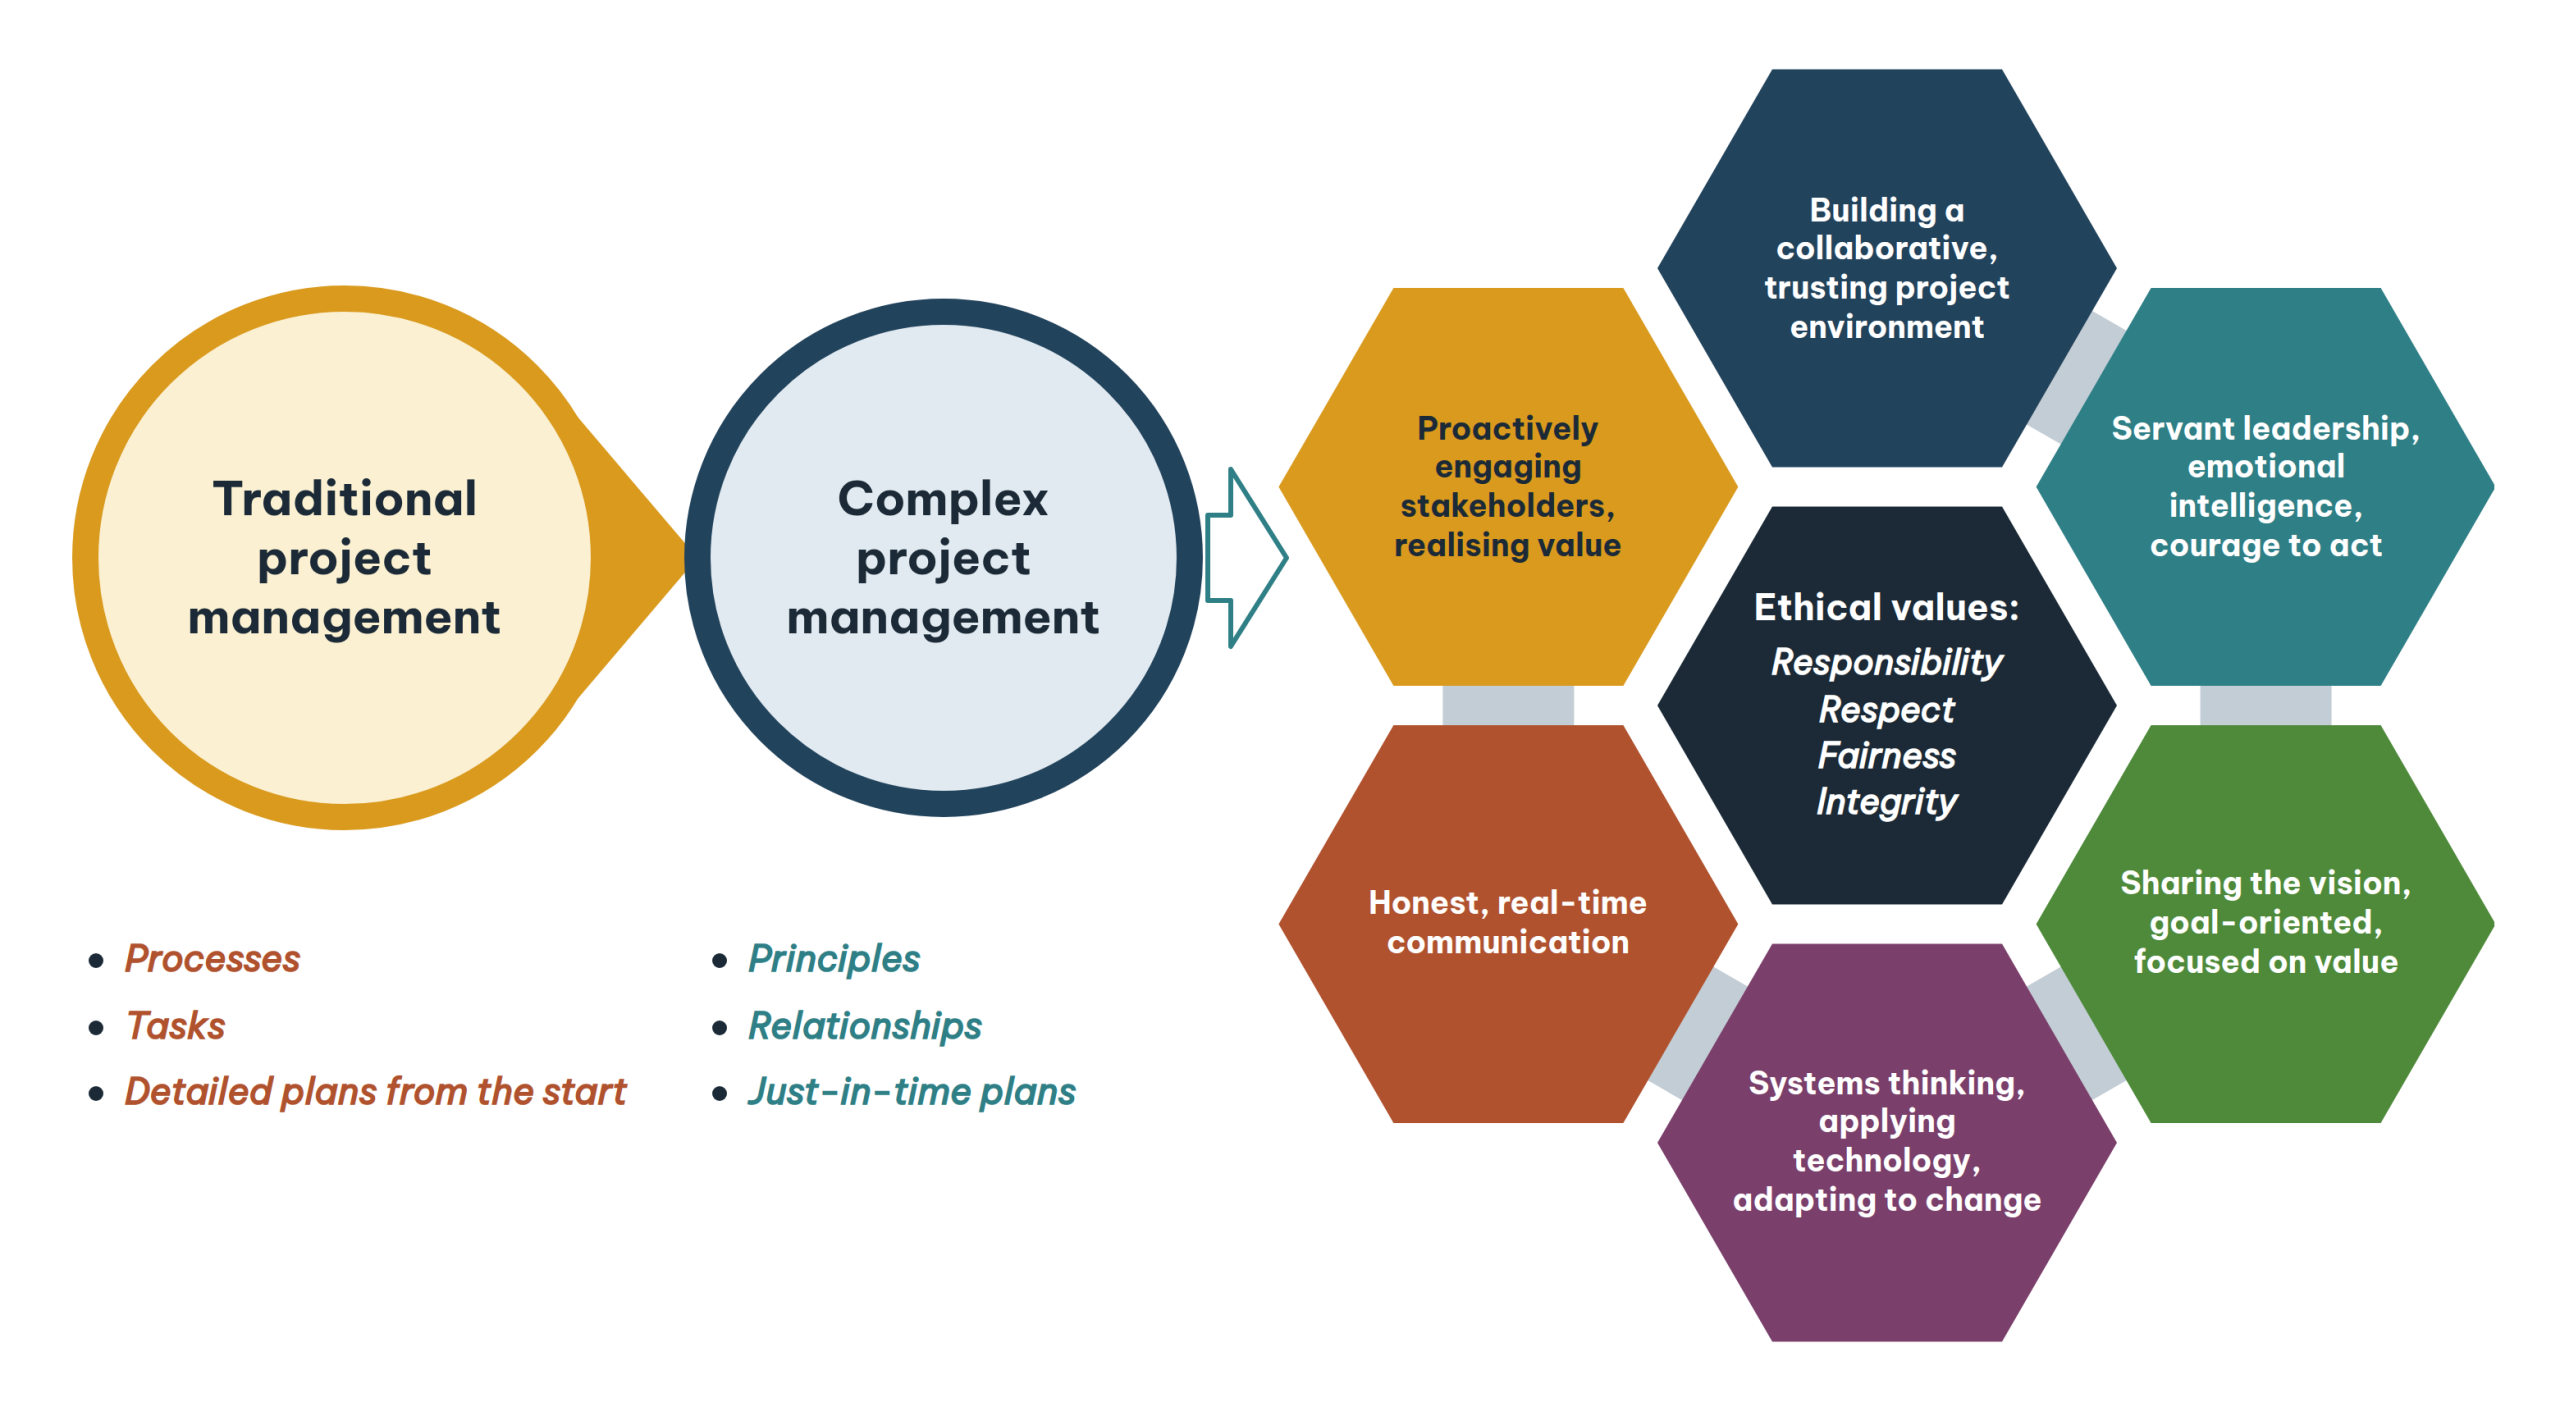
Figure 8.25. From processes, tasks and upfront detailed plans to principles, relationships and just-in-time plans; seven principles of complex project management around the core ethical values.
Choosing the right methodology
The choice rests on four assessments:
| Organisation
Core values, culture, strategy. |
Resources
Infrastructure, facilities and finance for the project. |
| Team
Competence and character of the project team. |
Project
How simple or complex it is. |
A complete methodology usually includes: guiding principles; definitions of the life cycle, steps, deliverables and decision points; a table of roles for direction, governance and management, with limits of authority; a competency framework; ethical standards; processes and procedures; templates; and a lessons-learned repository.
Apply it to your project
| REVIEW YOUR TOOLKIT
☐ The schedule has a network and critical path, not just a Gantt chart. ☐ Highly uncertain items use three-point (PERT) estimates, not a single figure. ☐ Monthly reports show PV, EV, AC, SPI, CPI and a forecast EAC. ☐ Schedule contingency is managed centrally (buffers), not spread across activities. ☐ There is a written PM methodology with roles, decision points and templates. |
Reflection questions
| FOR INDIVIDUAL REFLECTION OR GROUP DISCUSSION
1. Where does your project sit on the scale from simple to chaotic? Does the methodology in use fit? 2. Does your organisation calculate EVM, or only report “% physical progress”? What stands in the way? 3. Is there any part of your traditional project that could be run in short agile cycles? |
Quick check
Question 1. An activity is estimated at 6 days optimistic, 9 most likely and 18 pessimistic. The PERT expected time is:
- 9 days
- 10 days
- 11 days
- 12 days
Question 2. EV = 340, PV = 400, AC = 380. Which statement is correct?
- Ahead of schedule, under budget
- Behind schedule, over budget
- Behind schedule, under budget
- On schedule, on budget
Question 3. The key difference between critical chain and critical path is that critical chain:
- Does not use a network diagram
- Accounts for resource limits and uses buffers instead of float
- Applies only to software projects
- Has no completion date
Question 4. In Scrum, who accepts the results at the sprint review?
- The Scrum Master
- The finance director
- The Product Owner
- The whole team by vote
Question 5. As projects move from simple to complex, the management focus shifts to:
- More detailed processes
- Principles, stakeholder relationships and just-in-time plans
- Tighter control of every task
- Detailed plans from the start
Answers and explanations
Question 1: B. te = (6 + 4×9 + 18)/6 = 60/6 = 10 days.
Question 2: B. SPI = 340/400 = 0.85 < 1 (behind); CPI = 340/380 ≈ 0.89 < 1 (over budget).
Question 3: B. Critical chain considers resource dependencies; contingency is pooled into project, feeding and resource buffers.
Question 4: C. The Product Owner decides whether to accept the cycle’s results.
Question 5: B. Complex projects call for principles, relationships and just-in-time planning instead of processes, tasks and detailed upfront plans.
Key points
| THE ESSENTIALS OF THIS LESSON
• Every project is unique; classify it by system characteristics and uncertainty to choose the right approach. • The traditional approach rests on a predictive life cycle: WBS → Gantt/critical path/PERT → estimates → control with S-curves and EVM. • Critical path assumes unlimited resources; critical chain accounts for resource limits and uses project, feeding and resource buffers. • EVM combines PV, EV and AC: SV = EV − PV, CV = EV − AC, SPI = EV/PV, CPI = EV/AC, EAC = BAC/CPI. • Agile rests on 4 values, 12 principles and short cycles (Sprints); Scrum has 4 events: sprint planning, daily stand-up, review and retrospective. • The more complex the project, the more the focus shifts from processes, tasks and detailed plans to principles, relationships and just-in-time plans. |
This lesson is adapted from Chapter 8 of Quản lý dự án: Hiểu đúng & Làm thật (“Project Management: True Understanding, Genuine Action”) by Truong Van Thien (Construction Publishing House, Hanoi, 2025). The content has been condensed and reorganised for learning; full data, quotations and references are in the book.